
Introduction
The placenta is a multifunctional organ which ensures anchorage and vascular connection of the foetus to the mother. It transports nutrients and gases as well as hormones that are required for the successful progression of pregnancy.1 The placenta plays a major role in regulating foetal growth and development during pregnancy.1
Ultrasonography is commonly used to estimate gestational age (GA) in pregnancy by measuring foetal biometric parameters such as biparietal diameter (BPD), femur length (FL), head circumference (HC), and abdominal circumference (AC).2 Foetal biometry, a relevant and integral part of obstetric radiology, is necessary for the assessment of foetal growth throughout pregnancy.2
Placenta thickness changes are an expression of normal growth of the foeto-placental unit, which is measurable with the ultrasound and is of value in describing normal physiology.3 Unfortunately, sonologists pay limited attention to placental thickness in their routine evaluation of pregnancy.4 This study correlated placenta thickness with ultrasound estimated gestational age and foetal weight in healthy pregnant women between 13-37 weeks.
Materials and Methods
This was a hospital-based, prospective, cross-sectional study over a 1-year period (June 2016 to June 2017). Four hundred consenting healthy pregnant women, with singleton foetus, who were sure of the date of their last menstrual period, from gestational ages of 13 to 42weeks were consecutively recruited.
Excluded from the study were pregnant women with maternal illnesses such as pregnancy induced hypertension, diabetes mellitus or anaemia, haemoglobinopathies, maternal habits of cigarette smoking and/or alcohol intake, uterine masses like fibroids, multiple gestations, cconfirmed or suspected foetal chromosomal abnormalities, polyhydraminous, intrauterine foetal death, placenta masses such as chorioangioma of the placenta, morphological variation of the placenta in size and shape such as lobed placenta, succenturiate lobe, placenta membranacea, circumvallate placenta as well as placenta preavia and poor visualization of placenta insertion site due to obscuration by foetus or foetal part.
Relevant socio-demographic data were gotten with the aid of a proforma specially designed for the study. All consenting participants had an obstetric ultrasound scan using General Electric LOGIC 5 expert ®made in USA, 2003 with a curvilinear probe of 3.5MHz.
The study participants were advised to achieve a moderately filled urinary bladder by drinking about 250mls of water shortly before the obstetric ultrasound exam. During the ultrasonographic examination, the patients they were placed in a supine position with their abdomen minimally exposed to just above or to the level of the pubic hair, with underclothes on, a clean drape was placed over the pubic region up to mid-thigh for minimal and decent exposure. A generous amount of ultrasound gel was applied and the ultrasound probe manipulated over the abdomen in all quadrants just above the region of the symphysis pubis using the 3.5MHz transducer. An initial scan to exclude all foetal and maternal exclusion factors was performed. The placenta was identified as a hyperechoic area separated from foetus by an echolucent area of amniotic fluid. Placenta thickness was also measured.
Foetal lie and position were determined and the following foetal parameters were assessed; biparietal diameter (BPD), head circumference (HC), abdominal circumference (AC), femur length (FL) and the foetal weight (FW) estimated.5 All measurements were recorded in the participant’s proforma.
To determine the BPD, measurement was made on standard transverse axial plane passing through the widest portion of the skull, with both the thalamus and cavum septum pellucidum in the midline. The measurements were made from the outer border of the near skull to the inner border of the distal skull echoes, measurement was at the level of the parietal bones, and will be perpendicular to the falx cerebrum.5
The head circumference was measured at the same plane as the biparietal diameter. The perimeter of the skull including the bone but not the foetal hair and scalp, using track ball or electronic ellipse mode was measured. It is a more accurate predictor of GA when the skull shape is abnormal.5
The abdominal section that was used to determine the abdominal circumference was approximately round and passed through the upper abdomen and liver. Suitable landmarks are the upper portion of the stomach and a short section of umbilical vein lying in the anterior portion of the abdomen. Measurement of the abdominal circumference was taken in a plane perpendicular to the long axis of the foetus. The circumference was measured using the trackball.5
Measurement of the foetal femur length was made along the long axis of the diaphysis, disregarding the curvature of the medial borders and also the non-ossified proximal and distal epiphyseal cartilages.5
The estimated foetal weight was calculated automatically by the ultrasound machine using the method proposed by Hadlock et al.6 from the following foetal parameters, BPD, AC, and FL, using the following formulae:
Log10BW = 1.5 + x (BPD)2 + x (AC) + x (FL) – x (AC x FL)
To determine placenta thickness the two edges of the placenta were focused in a single ultrasonographic field in transverse and longitudinal sections. The probe was moved all over the localized placenta and the level of cord insertion was identified over the foetal surface. Colour flow Doppler interrogation was used to identify the insertion of the umbilical cord into placenta bulk. The image was frozen while the placenta thickness is measured at the level of umbilical cord insertion in the longitudinal plane. The placenta was visualized as having a uniformly moderate echogenicity. On its surface abutting the amniotic fluid, the chorionic plate (the chorioamniotic membrane) could be seen as a bright specular reflector when it is oriented perpendicular to the ultrasound beam.7 Electronic calipers were used to take the measurement of the placenta thickness at the insertion of the umbilical cord, on a plane perpendicular to the placental surface, from the chorionic plate to the beginning of the basilar-myometrial surface. A straight line was drawn from the level of cord insertion up to the maternal surface of the placenta and thus the maximum thickness was noted in the longitudinal plane. Each placenta was measured to a 1 mm precision, at its greatest thickness, which is perpendicular to the uterine wall. All measurements were taken three times and an average was used to ensure accuracy and reduce intra-observer variation. The uterine myometrium and the retro-placental veins were excluded in the measurements. Estimated gestational age was calculated from HC, BPD, AC and FL by the ultrasound machine.
Depth was adjusted so that the maximum placenta tissue was visualized on the screen. Gain was adjusted to achieve acceptable imaging and to minimize near field and reverberation artefacts. The following parameters were assessed and recorded on the proforma assigned to the woman: thickness of the placenta (in millimetres), estimated gestational age, estimated foetal weight and placenta position. The ultrasound gel was wiped off the patient’s abdomen with tissue paper after the procedure.
The data obtained from the proforma were entered into a Microsoft excel worksheet and statistically analysed using statistical package for social sciences, version 22 (SPSS v22) Chicago, Illinois. Descriptive statistics were calculated for continuous variables. Percentages and proportions were determined for categorical variables. Mean of two or more independent groups were compared using the Student ‘t’ test or analysis of variance (ANOVA) as appropriate. Pearson’s correlation and scatter plots were used to demonstrate the correlation between two numerical variables. Regression equation to assess the relationship between placenta thickness and estimated gestational age was determined using linear regression analysis. Confidence interval was put at 95% for all statistical tests unless otherwise stated. Statistical test was considered significant when p was < 0.05. Ethical approval was obtained from the Health Research and Ethics Committee of the study centre.
Results
Four hundred (400) women participated in the study. The ages of women studied ranged from 17-42 years, with a mean age of 30.8±4.8 years. The maximum number of participants was seen in the 25-34 years age group, total of which was 254 (63.5%) and the least was in women below 25years age group which was 46 (11.5%) of the study population. One hundred and seventy-two (43%) women were nulliparous while 372 (93%) had no history of previously induced abortion and 290 (72.5%) had no history of previous spontaneous abortion (Table 1).
There was a progressive increase in mean thickness from 14.50mm ± 0.71mm at 14 weeks of gestation to 36.58 ± 1.54 mm at 37 weeks. More participants were scanned in the third trimester 228 (57%) as against 172 (43%) in the second trimester (Table 2). The mean PT for each GA from 14–32 weeks GA was greater than corresponding GA. Beyond 32 weeks; PT measurement was less than GA (Table 2).
There was positive correlation between placenta thickness and all foetal parameters (Table 3). However, placenta thickness is most strongly correlated with EGA (r = 0.968, p <0.001) and AC (r = 0.953, p< 0.001) Least correlation was with the HC (r = 0.481, p <0.001) (Table 3). The correlation between placenta thickness and EGA was stronger during the second trimester (r=0.921. p<0.001) than the third trimester (r =0.871, p < 0.001) (Table 4).
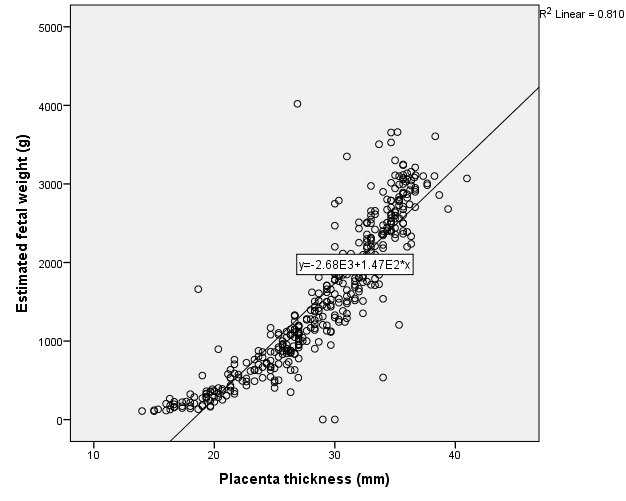
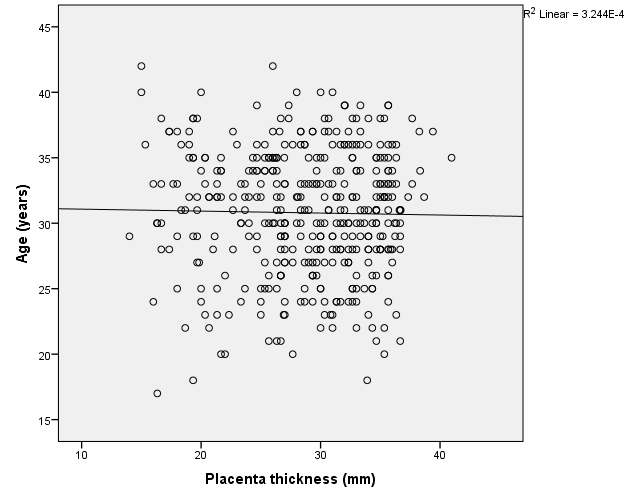
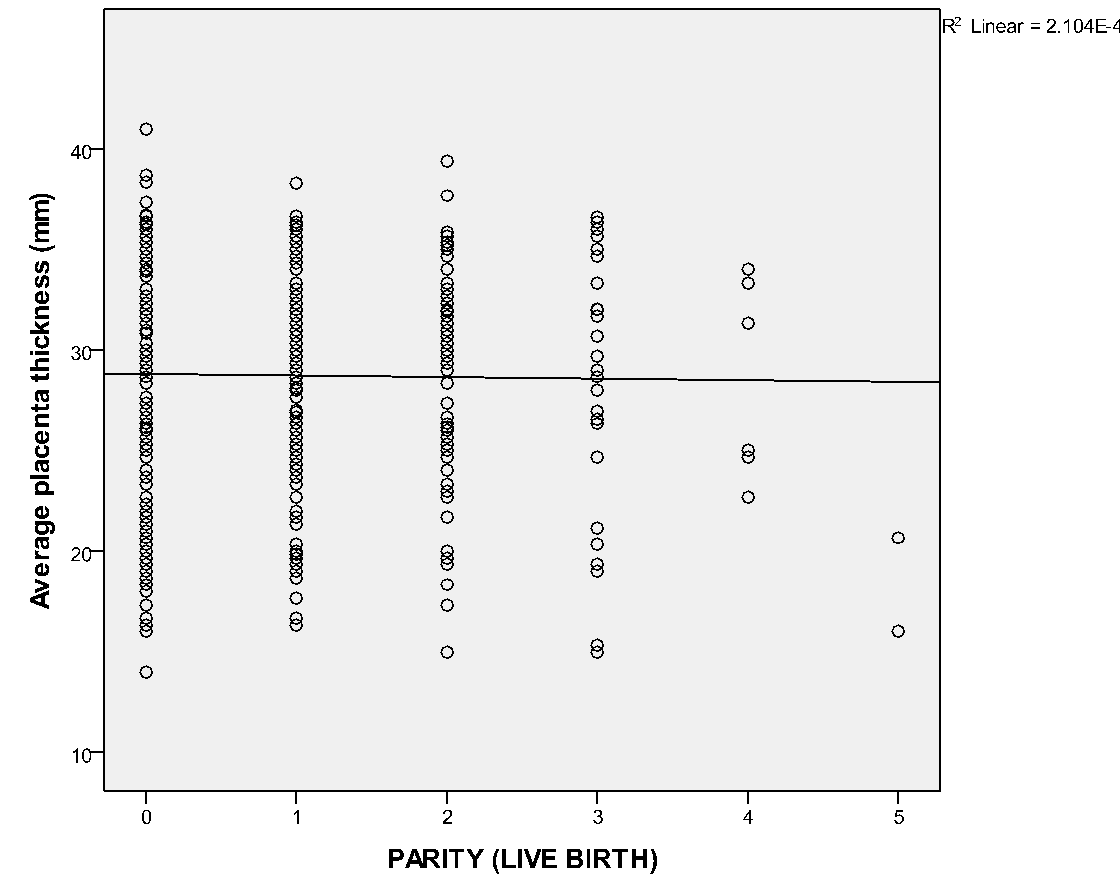
Placenta was thickest when it was located at the fundus (30.9 ± 5.6), antero-fundal (30.6 ± 5.0) and postero-fundal region (30.0 ± 5.1). However, the difference was not statistically significant (F= 2.389, p = 0.050) (Table 5). Placenta thickness increased significantly with foetal weight (r = 0.9, p <0.001) (Figure 1). There was no correlation between placenta thickness and maternal age (r = -0.018, p = 0.720) (Figure 2) as well as between placenta thickness and parity (r = -0.015, p = 0.772) (Figure 3).
Table 1
Profile of study participants
Table 2
Placenta thickness and gestational age
Table 3
Correlation of placenta thickness with foetal biometric parameters
Table 4
Correlation of placenta thickness and foetal parameters based on the trimester
Table 5
Mean placenta thickness measurement based on placenta position
Discussion
We found a progressive linear increase of the placenta thickness with advancing ultrasonographic estimated gestational age, with a very strong Pearson’s correlation coefficient of r = 0.968; p = 0.000. The correlation coefficient in second trimester was r = 0.921 while it was 0.871 in the third trimester. This shows that PT correlated more with GA in the second trimester than the third trimester. This is in consonance with the study of Kapoor et al.8 who observed that Pearson’s correlation coefficient was highest in second trimester in their study of 310 pregnant women in Punjagutta, India hence suggesting that the most significant correlation between PT and GA is in the second trimester. However, this is at variance with the study of Adhkari et al.9 in Nepal, India who found a stronger correlation between PT and GA in the third trimester with r of 0.946 in their study on 150 healthy pregnant women. This may be because the third trimester is when the foetus amasses a lot of fat hence the stronger correlation of PT with GA. Cultural practices may also account for this. It may also be due to the small sample size used by the researcher in Nepal, India which may not be a true representation of the populace.
Placenta thickness had a linear relationship with EGA from 14 to 34 weeks. The linear increase was sustained from 14 weeks GA and declined from 34 weeks. This finding is consistent with the observations made by Nagwanil et al.10 in Lucknow, India who found placenta thickness (mm) to be roughly equivalent to GA (in weeks). They reported that the mean thickness of the placenta was 3.90 ± 1.1 cm which increased till 38 weeks of gestation but thereafter decreased. Mittal et al. also found an increasing trend in the values of mean PT (in mm) with increase in GA (in weeks) and the PT (in mm) coincided almost exactly with the gestational age in weeks in their study in India.11 Jain et al. reported similar correlations between placenta thickness and gestational age.12 They found PT (in mm) almost matched GA in weeks from 27weeks to 33 weeks of gestation.12 Baghel et al.13 reported that placenta thickness in mm almost matched GA in weeks at 24 weeks (24.5 mm at 24 weeks), 32 weeks (31.8 mm at 32 weeks) and 36 weeks (35.5mm at 36 weeks). Nyberg and Finberg also reported that as a rule of thumb, the placenta thickness in mm parallels GA in weeks.14 Similarly in a study by Karthikeyan et al.2 it was reported that placenta thickness can be used as a predictor of the gestational age, in women whose LMP is unreliable or is unknown.
The correlation between PT and the established foetal biometric parameters which are HC, BPD, AC and FL were assessed. The PT in the index study correlated more with AC with a strong Pearson’s correlation of 0.953 followed by BPD with a Pearson’s correlation of 0.815, then FL with r = 0.762. The least correlation was with HC in the estimation of GA. The foregoing may be due to the fact that the foetal head is very malleable and is subjected to moulding depending on the stage of pregnancy and the position of the foetal head. The FL on the other hand also varies based on the genetic makeup of the foetus; short FL may be due to genetically short parents and long FL may be due to tall parents. The AC appears to increase constantly throughout pregnancy, as reflected in the index study. The reason for this may be because the abdominal circumference is less affected by moulding neither is it affected by the parental genetic makeup. These findings are similar to studies done by Arafa et al.,15 Ismail et al.16 and Elsafi et al.17 The index study is however at variance with the study of Suresh et al.18 in India where a hundred normal singleton pregnancies with GA 12 – 24 weeks showed a strong correlation between PT and FL (r = 0.982, p = 0.000). In the present study a stronger correlation for HC (r = 0.917, p = 0.000) compared to FL (r = 0.906, p = 0.000) was observed. This may be due to environmental factors.
The placenta thickness in our study showed an increase as foetal weight increased and a regression equation was formulated thus; estimated foetal weight = 147.1 PT - 2676.4. Estimated foetal weight can thus be calculated from PT and vice versa. The PT showed a strong correlation with EFW (r = 0.9). PT was fairly linear throughout the second and third trimester. This trend was also observed in the studies of Abu et al.,19 as well as Adeyekun et al.,20 among Nigerian women and they noted significant positive correlation between placenta thickness and EFW in the second and third trimesters. Some other studies have also corroborated this relationship of increasing foetal weight with increasing placenta dimension. This was seen in studies done by Habib21 among women in Saudi Arabia who concluded that the probability of a normal birth weight increases with increase in placenta thickness and diameter. De Paula et al.22 and Daskalis et al.23 in a study among Greek women reported that placenta size may be a useful predictor of neonatal weight.
We found no statistical significant correlation between PT and maternal age (r = -0.018 and p = 0.720). The proffered reason could be that maternal age has no influence on placenta formation and growth, even though the placenta is partly a maternal organ. Similar finding was ascertained in the study of Ismail et al.24 on 207 healthy Sudanese pregnant women who found no correlation between PT and maternal age. This may also be because of the influence the difference in ethnicity. Maternal parity also had no significant correlation with placenta thickness. This could be explained by the fact that every pregnancy is a new occurrence; hence, the placenta develops with each pregnancy and is completely removed following every child birth. Hence, the genetic makeup of the previous pregnancy does not have any effect on the index placenta development. Another reason could be that the placenta is a short lived maternal-foetal organ that nourishes and protects the foetus.
In conclusion, there was significant positive correlation between placental thickness and estimated gestational age and fetal weight. The regression equation derived, PT = 1.011 EGA – 0.663, can be used to estimate gestational age.