
Introduction
Various components impact the prosperity of the feto-maternal flow, specifically the umbilical cord (UC), which associates the developing fetus to the placenta. The altered structure and metabolism of the UC have been associated with pregnancy-related complications such as pregnancy-induced hypertension (PIH), preeclampsia, diabetes, intrauterine growth retardation (IUGR) and fetal distress.1, 2, 3, 4
In recent decades, routine antenatal ultrasonography is commonly used in the assessment of anthropometric measurement of fetus and placenta and also to detect intrauterine growth retardation (IUGR) and congenital anomalies. Various criteria and biochemical tests were used in high-risk population screening and fetal weight prediction to minimize perinatal complications. Yet women with high-risk pregnancies like the hypertensive disorder of pregnancy and diabetes mellitus were showing an increased incidence of maternal and fetal morbidity.
Recent research has shown that in normal and abnormal foetal development, the umbilical cord itself plays an important role.5 The existence of a thin or thick cord is associated with adverse maternal-fetal consequences.6, 7, 8 In order to find any association between the umbilical cord cross-sectional area (UCA) and fetal outcomes, it is important to know its reference ranges for cross-sectional areas (CSA) of umbilical cord and its components during gestation.
There is enough information in previous studies about the normal pattern of growth of the area of UC variables for different gestational age.1, 2, 4, 6, 9, 10 But there is paucity in literature regarding the pattern of growth of the area of UC variables in PIH UC for different gestational age. Therefore, we undertook the study to evaluate the CSA of UC variables in normal and PIH women based on different gestational age.
Materials and Methods
Study design
After obtaining approval from the ethical committee and informed consent from the patients, the study was conducted for a period of four years from January 2015 to November 2018. This cross-sectional research was performed in the Department of Radiology, Sri Siddhartha Medical College, Tumkur, in 300 normal and 300 PIH pregnant women who underwent routine ultrasound. The area of umbilical cord variables was taken in the third trimester, between 28th and 39 weeks of gestation. Measurements were obtained by using ultrasonography at the level of the section immediately adjacent to umbilical cord insertion into the fetal abdomen.4
Study population
300 pregnant women with normal blood pressure without oedema or proteinuria were included in the study as Normal group while 300 antenatal women with blood pressure >140/90 mmHg after 20 weeks of gestation were considered as PIH group. We undertook the study to evaluate the CSA of UC variables in normal and PIH women based on different gestational age. The gestational age was further divided into 4 groups: 28-30 weeks (wks), 31-33 wks, 34-36 wks, and 37-39 wks. Pregnant women with co-morbid conditions (e.g. gestational diabetes, chronic high blood pressure, IUGR, oligohydramnios, polyhydramnios, and intrauterine death) were the exclusion criteria.
Data collection
The measurements of all parameters were performed on a GE voluslon pro730 ultrasonic system by a single operator. All patients were scanned in a semi-recumbent position. To avoid interobserver variability, each ultrasound scrutiny was carried out by the same individual.
Statistical analysis
The data was analyzed by version 16.0 of the SPSS programme (SPSS Inc., Chicago, III., USA). The quantitative data were analyzed descriptively by means of frequencies, means and standard deviation. The significance of study parameters between three or more independent groups has been identified using Anova and between two groups by using the student “t” test. A p-value < 0.05 was found to be statistically significant.
Results
This study consists of 600 subjects (300 normal pregnant women and 300 PIH women) whose gestational age between 28-39 weeks was evaluated. The results were analyzed based on the following data: a) CSA of umbilical cord (UCA) b) CSA of umbilical Artery (UAA) c) CSA of umbilical vein (UVA) d) CSA of Wharton’s Jelly (WJA).
Table 1
Descriptive statistics of UC components area between the study groups
The mean area of umbilical cord components between the study groups indicates that there is a steady decrease in the size of UCA and its components in PIH women relative to normal pregnant women except UAA (Table 1).
Table 2, Table 3 shows the mean ± S.D of the measurements for the cross-sectional area of the umbilical cord components for each gestational age (GA) in the normal and PIH group respectively.
Table 2
Cross-sectional area of umbilical cord components based on gestational age distribution in normal group
Table 3
Cross-sectional area of umbilical cord components based on Gestational age distribution in PIH group
Discussion
The current study analyzed in normal pregnancy and the effects of PIH on the area of UC and its components for different gestational age, utilizing sonographic cross-section. The following results points should be emphasized.
It has been observed that the size of the UCA in PIH women has steadily decreased. In PIH group, UCA was substantially smaller than uncomplicated pregnancies (t = 20.109, p = 0.000). This finding is consistent with results from previous studies performed either ultrasonographically or at histological examination. Our observation is in concordance with Raio et al. who conducted a case control study to determine and correlate the morphometry of umbilical cord in normal and preeclamptic pregnant women by using ultrasonography. Raio et al. (2012) reported that the UCA was reduced in Preeclamptic women (158 mm2) compared to controls (196 mm2).11
Inan et al (2002) conducted a histo-morphological study on preeclamptic umbilical cord with normal and pathological Doppler FVW. There is an evident reduction in the wall thickness of the vessels along with reduction of the total cord area and total vessel area in preeclampsia. They also witnessed that these changes are more predominant in pathological Doppler FVW, which is suggestive of a hypoplastic mechanism.12 Similarly, Barnwal et al. (2012) conducted a histological study and stated that the UC of preeclamptic women (51.56 mm2) was characterized by a reduction of the total cord area in comparison with Normotensive women (47.05 mm2).13
The difference in the size of the UC in the above said studies may be due to variation in the method of sample collection technique and measurements. Comparison of the mean UC variables in different studies was given in Table 4.
Table 4
Comparison of Mean UC variables in different studies
|
UC Variables |
Raio,11 Italy, 2002 |
Inan,12 Turkey, 2002 |
Barnwal,13 India, 2012 |
Blanco M.V14 Argentina, 2011 |
Present Study |
|
UCA-Normal |
196 |
63.58 |
51.56 |
- |
1.76 |
|
UCA- PIH |
158* |
41.84* |
47.05 |
- |
1.63* |
|
UAA-Normal |
7.1 |
2.97 |
2.09 |
56.6 |
0.15 |
|
UAA- PIH |
6.6 |
2.06* |
2.66 |
116.4* |
0.16 |
|
UVA-Normal |
37.4 |
6.28 |
4.61 |
109.8 |
0.56 |
|
UVA-PIH |
29.2* |
2.51* |
9.51* |
155.9 |
0.52* |
|
WJA- Normal |
138.7 |
51.37 |
42.27 |
- |
0.90 |
|
WJA- PIH |
105.8* |
35.22* |
32.11* |
- |
0.80* |
In the present study, the mean cross-sectional area of UV had significantly smaller in PIH women as compared to the normal group. Our finding is in agreement with the findings of previous studies conducted by Raio et al and Inan et al.11, 12 But on contrary, Barnwal et al and Blanco et al recorded that the mean UVA was higher in preeclamptic group than the control group.13, 14 No significant difference was observed in the area of UA, though there is slight increase in the area of in PIH women than normal pregnant women.
To keep transmural pressure constant in case of preeclampsia, there is an obvious increase of compliance in the umbilical artery due to an increase in intraluminal pressure where as in umbilical vein, there is an apparent decrease of compliance due to a reduction in the intraluminal pressure.12, 15, 16
In the extensive review of literature, we found a few nomograms of CSA of UC variables for different gestational age. There is enough information in previous studies about the normal pattern of growth of the area of UC variables for different gestational age. Raio et al. conducted a sonological study to compare the mean cross-sectional area of UC in preeclamptic women and in Normotensive pregnancies. He concluded that his results follow the usual reported trend of the normotensive having larger values than the preeclamptic women.11 But there is paucity in literature regarding the pattern of growth of the area of UC variables in PIH UC for different gestational age. Therefore, we undertook the study to evaluate the CSA of UC variables in normal and PIH women based on different gestational age.
We included the women whose gestational age was between 28-40 weeks of a normal pregnancy and PIH women. We further disturbed the gestational age into 4 groups as 28-30 weeks, 31-33 weeks, 34-36 weeks, and 37-39 weeks.
In the present study, we observed that the mean value of UCA and WJA is increased till 36 weeks then it decline sharply in the normal group whereas in the PIH group, the mean value of UCA increases till 36 weeks then it attains plateau and the mean value of WJA increases even after 36 weeks. A statistically significant correlation was observed between UCA and gestational age (GA), WJA and gestational age (GA) in both the normal and PIH group (Figure 2, Figure 1).


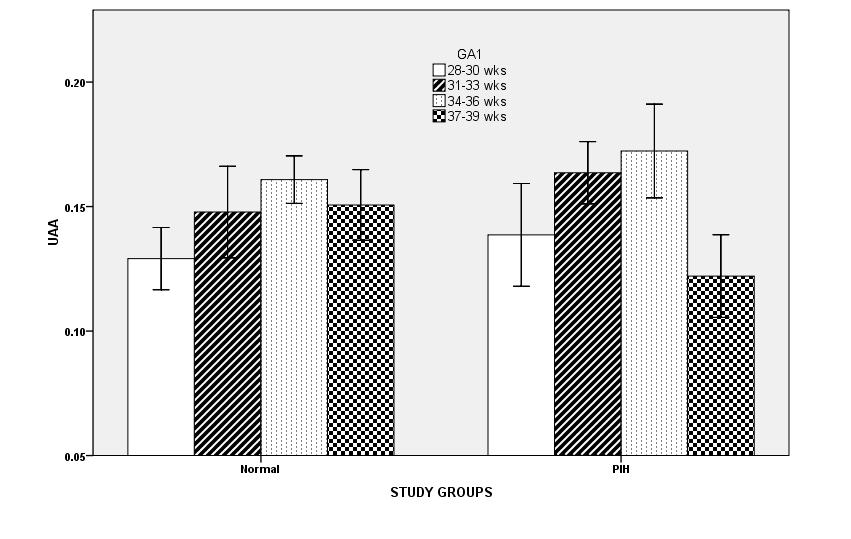
We observed that the mean value of UAA is increased till 36 weeks then it decline sharply in both normal and PIH group. A statistically significant correlation was observed between cross-sectional area of the umbilical artery and gestational age (GA) in both the normal and PIH group (Figure 3).
In the mean value of UVA, we observed that there is an increased in the size of UVA till term in the normal group whereas in the PIH group, it increases till 36 weeks then it decline which is statistically significant (Figure 4).

We have noticed that the UC variables show significant changes after the 36th weeks in both the normal and PIH group. So, it advisable for sonologist and obstetricians to have an extra care while measuring the UC variables during or after 36 weeks, which may be an alarming weeks in case of PIH or IUGR.
Conclusion
Our study was the first of its kind to report the references value and growth pattern of the cross-sectional area of UC variables that can serve as an informative database of Indian fetuses in both normal and PIH pregnant women. It may improve the predication of adverse perinatal outcomes particularly during or after a gestation period of 36 weeks. In order to further explore the possible role of umbilical cord variables in the assessment and follow-up of high-risk pregnancies, larger-scale research needs to be carried out.
Ethical Approval
The study protocol was approved by the Institutional Ethics Committee of Sri Siddhartha Medical College. All patients provided written informed consent.
Authors Contributions
Initials of the contributing authors are listed in brackets at the relevant parts of the research: Study concept & design, Literature search, Data collection, Statistical data analysis, Data interpretation and drafting the manuscript (K.H.A.M.), Supervision (L.S.R.). Both authors approved the final version of the article.