- Visibility 242 Views
- Downloads 22 Downloads
- DOI 10.18231/j.ijogr.2020.004
-
CrossMark

A comparative study of the accuracy of the spot Protein-Creatinine Ratio (PCR) vs 24 hours urine collection for detection of proteinuria in pre- eclamptic patients and its effect maternal and fetal outcomes
Introduction
Hypertension during pregnancy is one of the commonest medical complications, which leads to bad perinatal and maternal outcome even though a number of efforts have been made to do early diagnosis, prevention and the treatment.[1] Preeclampsia and eclampsia is the third leading cause of maternal mortality worldwide and is a leading cause of perinatal mortality and morbidity.
The World Health Organisation (WHO) estimates around 600,000 women will die each year from preeclampsia.[2] Preeclampsia complicates 2-8% of all pregnancies.[3] it is a multisystem endothelial disease that leads to increased permeability of glomerular basement membrane to protein with resulting proteinuria. Preeclampsia is diagnosed with elevated blood pressure (systolic ≥ 140 and diastolic ≥ 90) and proteinuria (>300 mg/24 hour) after the 20th week of gestation in a previously normotensive non- proteinuric patient.[4]
Urine collection over 24 hours is considered the traditional comparator for quantification of proteinuria in pregnancy, when significant proteinuria is defined as proteinuria of 0.3 g/day or more. The urine requires refrigeration and its collection is cumbersome, time consuming (for women and ward staff), and potentially misleading if collected inaccurately.[8], [7], [6], [5] Because of the disadvantages of 24 hour urine collection, alternatives f or the diagnosis of proteinuria in pregnancy have been considered. These include urinary dipsticks, urine collections over a shorter period, the urinary spot protein:creatinine ratio, and the urinary spot albumin: creatinine ratio.
Materials and Methods
A hospital based prospective study was conducted with 120 patients to assess the quantification of proteinuria in preeclamptic patient and comparing the two methods i.e. 24-hr urine protein levels and random protein creatinine ratio over 1 year at tertiary care centre at Dr. D. Y. Patil Medical College & Research Center, Pimpri, Pune.
Sample size: 120 patients (calculated as per suitable statistical formula).
Sample size was calculated using formula:
n = Zα2 p (1-p) / E2
n=sample size
Zα=Level of significance at 95% confidence level = 1.96
p = probability = 0.5
q = 1-p = 1-0.5 = 0.5
E= Error = 9%
n = (1.96)2 * (0.5) * (0.5) / (0.09)2 = 118.56
Hence a sample size of 120 patients was taken for our study.
Objectives
To study the correlation between 24 hours total urinary protein level and protein/creatinine ratio.
To evaluate protein- creatinine ratio for different proteinuria ranges in patients with preeclampsia.
To compare other method i.e. dipstick 24 hours urine collection with spot urinary protein- creatinine ratio.
To find out the effect of proteinuria on maternal outcome.
To find out the effect of proteinuria on fetal outcome.
Inclusion criteria
Age group 20-35yrs.
Patient who is willing to give consent.
Patient who met the criteria of pre-eclampsia.
Exclusion criteria
Chronic hypertension.
Preexisting intrinsic renal disease.
Urinary tract infection.
Diabetic renal glomerulopathy.
Preeclampsia superimposed on chronic HTN.
Hematuria
Procedure of collection of material
After approval from the Institutional Ethics Committee valid informed consent was taken. Once the patients were enrolled for the study after counseling, a thorough history and physical examination was done as per proforma (Annexure). An informed consent was taken from patients or patient’s attendant.
Two groups of patients were enrolled in the study: 1st group, who does not have features suggestive of pre-eclampsia that is control group and 2nd group included those patients who satisfy all the pre-eclampsia criteria. i.e. blood pressure of 140/90 mmHg or higher after 20 weeks of gestation accompanied by new-onset significant proteinuria, which is accepted as urine protein excretion greater than or equal to 300 mg/24 h. The patients were admitted in hospital one day prior in the evening. Then after passing the first urine in the morning the 2nd urinary midstream sample were taken for assessment of protein/creatinine ratio. All the patients were briefed in detail regarding urine tests to be performed upon them over the next 24 hours.
From the time of next urination, the sample for 24-hour urinary collection by noting exact time was done. All women, irrespective of the severity of the disease, were asked to provide a 24-hour urine collection for determination of proteinuria. The subjects were advised to pass urine at 8:00 am and collect all the urine subsequently till 8:00 am the next morning (24-hour period). The adequacy of urine collection was determined by creatinine excretion.
Preeclampsia was diagnosed based on blood pressure recordings of 140/90 mmHg or greater on at least two occasions, a minimum of 4 hours apart, after the 20th week of pregnancy, along with proteinuria ≥ 1 + detected by dipstick urine analysis.
Participants were instructed to collect a midstream urine sample for estimation of the spot urine P/C ratio and qualitative urinary protein estimation by dipstick, graded as 1 + or 2 +. They were then asked to collect the 24-hour urine starting with the second urine sample of the morning (after discarding the first sample of the day) till the first sample collected the following morning.
The urine P/C ratio was calculated by dividing the urinary protein concentration by the urinary creatinine concentration. Urine protein was estimated by an adaptation of the pyrogallol red-molybdate method.
Urine creatinine was estimated by the CREA method, a modification of the Jaffe’s reaction. Both tests were performed using an automated analyzer. All patients were followed up till delivery. The protein/creatinine ratio, dipstick and 24-hour protein excretion were then compared. Reference ranges for protein/creatinine ratio was taken as <0.3 and >0.3. 24-hour urine protein excretion was graded into 3 groups: <300 mg, 300-1000 mg and >1000 mg. Dipstick was graded 1 + and 2 +.
Statistical analysis
Quantitative data is presented with the help of Mean and Standard deviation. Comparison among the study groups is done with the help of unpaired t test as per results of normality test. Qualitative data is presented with the help of frequency and percentage table. Association among the study groups is assessed with the help of Fisher test, student ‘t’ test and Chi-Square test. ‘ p ’ value less than 0.05 is taken as significant.
Using protein values of 300, 1.000, 2.000, 4.000, and 5.000 mg on 24-hour urine collections, the performance of the protein-creatinine ratios to predict proteinuria were analyzed by the area under the receiver operator characteristic (ROC) curves. A 5% type-I error level was used to infer statistical significance (i.e. < 0.05).
Results
Distribution of patients according to Age, BMI, Parity & Gestational Age at Admission
Majority of the patients (51.7%) were in the age group of 26-30 years followed by 35% in the age group of 20-25 years and 13.3% in the age group of 31-35 years. The mean age of the patients was 26.47 ± 3.22 years. 45 (37.5%) patients had BMI in the normal range while 32 (26.7%) and 43 (35.8%) patients were overweight and obese respectively. The mean BMI of patients was 27.32 ± 3.43kg/m2. 57 (47.5%) patients were Primigravida while 42 (35%) patients were Gravida 2. 15 (12.5%) and 6 (5%) patients were Gravida 3 and ≥ Gravida 4 respectively. 67 of the patients (55.8%) were at ≥34 weeks of gestational age at admission while 53 (44.2%) patients were at <34 weeks of gestational age. The mean gestational age of patients was 32.63 ± 4.13 weeks.
Baseline Characteristics of patients
The mean spot urinary protein and spot urinary creatinine values in patients were 32.15 ± 11.68 mg/dl and 62.60 ± 13.68 mg/dl respectively while the mean blood urea and mean serum creatinine values in patients were 29.33 ± 6.06 mg/dl and 6.93 ± 3.63 mg/dl respectively.
Distribution of patients according to 24-hour urine protein
46 (38.3%) patients had no proteinuria (<300 mg/24h) while 70 (58.4%) and 4 (3.3%) patients had mild (300-1000 mg/24h) and severe (>1000 mg/24h) proteinuria respectively. The mean 24-hour protein of patients was 547.60 ± 424.89 mg/24h.
Distribution of patients according to Spot Protein: Creatinine ratio
41 (34.2%) patients had spot protein: creatinine ratio <0.3 while 79 (65.8%) patients had a ratio ≥ 0.3.
Distribution of patients according to Dipstick results
The dipstick results were negative in 19 (15.8%) patients while it was 1+ and 2+ in 48 (40%) and 49 (40.8%) patients respectively. The dipstick results were 3+ and 4+ in 2 (1.7%) patients each.
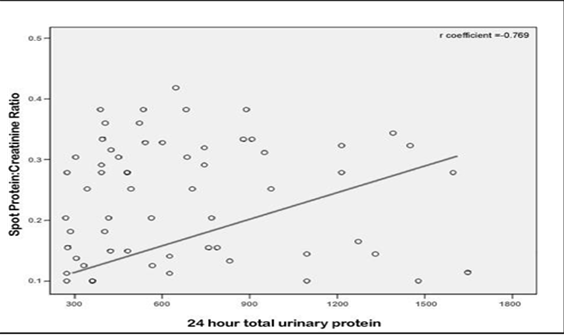
Correlation between 24-hour total urinary protein level and spot protein: creatinine ratio
[Figure 1] shows the relationship between 24-hour total urinary protein level and spot protein: creatinine ratio. There was a good positive statistical correlation between 24-hour total urinary protein level and spot protein: creatinine ratio with a correlation coefficient (r) of 0.769.
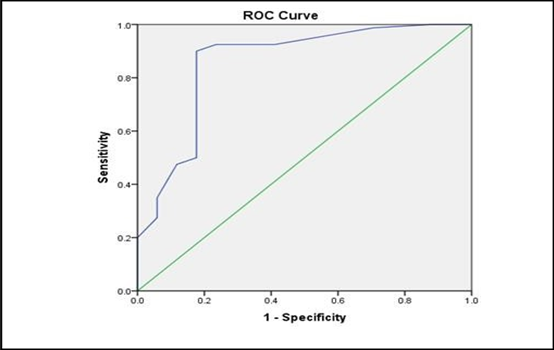
ROC Curve and Diagnostic Performance of spot protein-creatinine ratio for different proteinuria ranges in patients
The receiver operating characteristic (ROC) curve for spot protein-creatinine ratio is shown in Graph 2. The area under the ROC curve is 0.81 (95% CI 0.68–0.92; p<0.05).
Diagnostic Performance of spot protein-creatinine ratio for different proteinuria ranges in patients
Sensitivity and specificity for various cut offs of protein-creatinine ratio are shown in [Table 1] . With a cut off protein: creatinine ratio greater than 1.17 as a predictor of significant proteinuria, with sensitivity of 73.1% and specificity of 75.7%.The positive predictive value was 95.1% and negative predictive value was 28.6% (i.e. patients with a protein: creatinine ratio ≥1.17 were 95% likely to have significant proteinuria) is noted with this cut off. Thus, a positive ratio (≥1.17) is indicative of disease.
| Cut-off | Sensitivity (%) | Specificity (%) | PPV (%) | NPV (%) |
| 0.68 | 86.1% | 62.7% | 91.7% | 40.2% |
| 1.08 | 81.3% | 69.2% | 94.6% | 33.7% |
| 1.17 | 73.1% | 75.7% | 95.1% | 28.6% |
| 1.29 | 69.7% | 75.7% | 94.7% | 29.6% |
| 1.37 | 65.3% | 82.7% | 95.1% | 26.3% |
Association of Dipstick results and spot protein-creatinine ratio in patients
All patients with negative dipstick results had spot protein-creatinine ratio <0.3 while 3 (2.5%) and 45 (37.5%) patients with 1+ dipstick results had had spot protein-creatinine ratio <0.3 and ≥ 0.3 respectively. All patients with 2+, 3+ and 4+ dipstick results had spot protein-creatinine ratio ≥ 0.3. There was significant association of dipstick results and spot protein-creatinine ratio in patients as per Chi-Square test (p<0.05).
| Dipstick results | <0.3 mg/mg | ≥0.3 mg/mg | Total | p Value | |||
| N | % | N | % | N | % | ||
| Negative | 19 | 15.8% | 0 | - | 19 | 15.8% | <0.05 |
| 1+ | 3 | 2.5% | 45 | 37.5% | 48 | 40% | |
| 2+ | 0 | - | 49 | 40.8% | 49 | 40.8% | |
| 3+ | 0 | - | 2 | 1.7% | 2 | 1.7% | |
| 4+ | 0 | - | 2 | 1.7% | 2 | 1.7% | |
| Total | 22 | 18.3% | 98 | 81.7% | 120 | 100% |
Results
All patients with negative dipstick result had 24 hours urine protein less than 300mg/24 h while 26(21.7) and 46 (38.3) with dipstick +1 has less than 300mg/24h and more than 300mg/24h protein respectively. All other patients with +2, +3, +4 dipstick result have more than 300mg/24 h protein. There were significant associations of dipstick results and 24 hours urine protein as per chi-square test. (p<0.0001).
Association between Dipstick, UPCR and 24 hours protein in study group
Out of total 120 patients in the study, total 19(15.8) patients had negative urine dipstick test. In these patients UPCR and 24-hour urinary protein both were found to be <0.3 and <300 respectively, which was statistically significant.
| Dipstick | Protein creatinine ratio | 24 hrs protein | Total | |||
| <0.3 | ≥0.3 | <300 | 300 – 1000 | >1000 | ||
| 1+ | 3(2.5) | 45 (37.5) | 26 (21.7) | 22(18.3) | 0 | 48(40) |
| 2+ | 0 | 49 (40.8) | 1 (0.8) | 46(38.3) | 2(1.7) | 49(40.8) |
| 3+ | 0 | 2 (1.7) | 0 | 1(0.8) | 1(0.8) | 2(1.7) |
| 4+ | 0 | 2 (1.7) | 0 | 1(0.8) | 1(0.8) | 2(1.7) |
| Negative | 19(15.8) | 0 | 19 (15.8) | 0 | 0 | 19(15.8) |
| Total | 22(18.3) | 98 (81.7) | 46 (38.3) | 70(58.3) | 4(3.3) | 120(100) |
| Chi-square | 101.21 | 91.84 | ||||
| P Value | <0.0001 | <0.0001 |
Out of total 48 patients with 1+ urine dipstick, 3 patients had UPCR of <0.3 and 45(37.5) patients with UPCR >0.3 and for the same patients 24-hour urinary protein in 26(21.7) patients was found to be <300 and in 22(18.3) patients was found to be between 300-1000 and no patients had >1000, which was statistically significant.
Out of total 49 patients with 2+ urine dipstick, all the 49(40.8) patients had UPCR >0.3 and for the same patients 24-hour urinary protein in 1(0.8) patient was found to be < 300 and in 46(38.3) patients was found to be between 300-1000 and 2(1.7) patients with >1000, which was statistically significant. There were 2(1.7) patients with 3+ urine dipstick, both the patients had UPCR >0.3 and for the same patients 24-hour urinary protein in 1(0.8) patient was found to be between 300-1000 and 1(0.8) patients with >1000, which was statistically significant.
Similarly, there were 2(1.7) patients with 4+ urine dipstick, both the patients had UPCR >0.3 and for the same patients 24-hour urinary protein in 1(0.8) patient was found to be between 300-1000 and 1(0.8) patients with >1000, which was statistically significant.
Distribution of patients according to Maternal Outcomes
Significantly higher number of patients with severe proteinuria had induced labour (75%) compared to patients with mild proteinuria (54.3%) and no proteinuria (43.5%) as per Student t-test (p<0.05). Similarly, higher number of patients with severe proteinuria underwent cesarean delivery (75%) compared to patients with mild proteinuria (65.7%) and no proteinuria (54.4%) as per Student t-test (p<0.05). Similar incidence of Placenta previa and Post-partum hemorrhage were observed across all three groups. 1 (0.8%) patient with severe proteinuria died in the study.
Distribution of patients according to Fetal outcomes
The mean gestational age at delivery was significantly lesser in patients with severe proteinuria (33.25±0.96 weeks) compared to patients with mild proteinuria (37.39±1.94 weeks) and no proteinuria (39.07±0.25 weeks) as per Student t-test (p<0.05). The mean fetal birth weight was significantly lesser in patients with severe proteinuria (1.88±3.39kgs) compared to patients with mild proteinuria (2.45±2.24kgs) and no proteinuria (2.74±3.17kgs) as per Student t-test (p<0.05).
All patients with severe proteinuria delivered neonates with low birth weight (<2.5kg) while 35 (50%) and 7 (15.2%) patients with mild and no proteinuria delivered neonates with LBW. Similar incidence of NICU Admission and APGAR <7 at 5 mins were observed across all three groups. There was significant higher incidence of intrauterine fetal death (IUFD) in patients with severe proteinuria (50% vs. 8.6% vs. 6.5%; p<0.05). 2 (1.6%) neonates died in the study – 1 (0.8%) neonate each to patient with mild and severe proteinuria.
Discussion
Increased rate of maternal and fetal mortality and morbidity is associated with preeclampsia.[10], [9] Proteinuria is a main component of preeclampsia and one of the diagnostic criteria of its severity. Protein measurement in the 24-hour urine sample is the traditional standard method for the detection of proteinuria.[11] Twenty-four-hour urine collection is time-consuming and inconvenient, and results may be inaccurate when the collection of urine is missed, depending upon the individual. The management of patients may be delayed during the urine collection. A more rapid test that enables the accurate. prediction of 24-hour urine results would be valuable. alternatively, random spot urine protein to creatinine (P/C) ratio has been examined.[13], [12]
Due to high accuracy, reproducibility, and convenience compared with 24-hour protein collection, the P/C ratio in spot urine was developed as an alternative test in the non-pregnant population.[14] Morales et al reported the potential error in determining protein in a spot urine sample due to daily variation that does not exceed the error in collecting a 24-hour urine sample.[15] However, in pregnant women, there is no reliable evidence about the optimal cut-off value for spot urine P/C ratio for defining preeclampsia. The most recent meta-analysis implied that the optimum threshold for P/C ratio to define significant proteinuria is between 0.30 and 0.35, regarding to sensitivity and specificity values above 75%; when the sensitivity and specificity above 80% was accepted, there was no cut-off found.[16]
The present study indicated that P/C ratio has a good correlation with 24-hour urine protein excretion with a correlation coefficient (r) of 0.769. It was observed in the present study that all patients with negative dipstick results had spot protein-creatinine ratio <0.3 while 3 (2.5%) and 45 (37.5%) patients with 1+ dipstick results had spot protein-creatinine ratio <0.3 and ≥ 0.3 respectively. All patients with 2+, 3+ and 4+ dipstick results had spot protein-creatinine ratio ≥ 0.3. There was significant association of dipstick results and spot protein-creatinine ratio in patients as per Chi-Square test (p<0.05). This is similar to the studies of Pallavee P et al[17] and Hossain Set all.[18]
There was a good positive statistical correlation found between 24-hour total urinary protein level and spot protein: creatinine ratio with a correlation coefficient (r) of 0.769. The receiver operating characteristic (ROC) curve for spot protein-creatinine under the ROC curve area is 0.81 (95% CI 0.68 – 0.92; p<0.05). Sensitivity and specificity for various cutoffs of protein-creatinine ratio was found with a cut off protein: creatinine ratio greater than 1.17 as a predictor of significant proteinuria, sensitivity and specificity were 73.1% and 75.7%, respectively. With this cut off, the positive predictive value was 95.1% and negative predictive value was 28.6% (i.e. patients with a protein: creatinine ratio ≥ 1.17 were 95% likely to have significant proteinuria). All patients with > 2+ dipstick results had spot protein-creatinine ratio ≥0.3 which was significant association of dipstick results and spot protein-creatinine ratio in patients as per Chi-Square test (p<0.05).
Significantly higher number of patients with severe proteinuria had induced labour (75%) compared to patients with mild proteinuria (54.3%) and no proteinuria (43.5%) as per Student t-test (p<0.05). Similarly, higher number of patients with severe proteinuria underwent cesarean delivery (75%) compared to patients with mild proteinuria (65.7%) and no proteinuria (54.4%) as per Student t-test (p<0.05). 17. All patients with severe proteinuria delivered neonates with low birth weight (<2.5kg) while 35 (50%) and 7 (15.2%) patients with mild and no proteinuria delivered neonates with LBW. Similar incidence of NICU Admission and APGAR <7 at 5 mins were observed across all three groups. It was thus noted that higher the degree of proteinuria was directly proportional to increased rates of ceasarian section in mothers and decreased birth weight in newborns.
The study helped us to derive that, spot urinary P/C ratio in hospitalized women with suspected preeclampsia can be used as a screening test as a good predictor for significant proteinuria. The P/C ratio could not be used for diagnostic tests to replace 24-h urine protein measurements; on the other hand, the P/C ratio seems to be highly predictive for diagnosis to capture cases of over one gram proteinuria in a day. Therefore, it could be used as a rapid alternative test in patients with poor clinical status in order to prevent any delay in the implementation of treatment
Conclusion
Obstetric care providers need to be familiar with the diagnosis of pre-eclampsia, the hypertensive condition associated with the highest risk of adverse maternal and perinatal complications and a condition that affects 2- 5% of pregnancies.Random and spot urine protein creatinine ratio can predict with high accuracy the amount of 24- hour urine protein excretion. So, this can be used as a reasonable, affordable, alternative to the 24-hour urine collection to detect the significant proteinuria in hospitalized pregnant women. Thus, this study demonstrates that in hospital where appropriate laboratory personnel and where patients can afford it, routine use of UPCR for quantitation of proteinuria in patients could be adopted. The UPCR is reliable, relatively faster and accurate for proteinuria and can correlate well with 24-hour urinary protein excretion which is gold standard.
Study Limitations
Future study with a larger population with randomised study need to be focused on the evaluation of clinical outcomes and the cost-effectiveness of the use of random urinary PCR for prediction of significant proteinuria.
Aknowledgements
None
Conflict of interest
The authors declare that they have no conflict of interest.
Source of funding
Self-funded
References
- J M Roberts, G Pearson, J Cutler, M Lindheimer. Summary of the NHLBI working group on research on hypertension during pregnancy. Hyperten 2003. [Google Scholar]
- . World Health Organization. WHO recommendations for prevention and treatment of pre-eclampsia and eclampsia: implications and actions. 2014. [Google Scholar]
- L Duley, S Meher, E Abalos. Management of pre-eclampsia. BMJ 2006. [Google Scholar]
- A M Cote, T Firoz, A Mattman. The 24-hour urine collection: gold standard or historical practice?. Am J Obstet Gynecol 2008. [Google Scholar]
- . Report of the National High Blood Pressure Education Program Working Group on High Blood Pressure in Pregnancy. Am J Obstet Gynecol 2000. [Google Scholar]
- M E Helewa, R F Burrows, J Smith, K Williams, P Brain, S W Rabkin. Report of the Canadian Hypertension Society consensus conference: Definitions, evaluation andclassification of hypertensive disorders in pregnancy. CMAJ 1997. [Google Scholar]
- M A Brown, W M Hague, J Higgins, S Lowe, L Mccowan, J Oats. The detection, investigation and management of hypertension in pregnancy: executive summary. Aust N Z J Obstet Gynaecol 2000. [Google Scholar]
- M A Brown, M D Lindheimer, M De Swiet, A Van Assche, J M Moutquin. The classification and diagnosis of the hypertensive disorders of pregnancy: statement from the International Society for the Study of Hypertension in Pregnancy (ISSHP). Hypertens Pregnancy 2001. [Google Scholar]
- . World Health Organization International Collaborative Study of Hypertensive Disorders of Pregnancy. Geographic variation in the incidence of hypertension in pregnancy. Am J Obstet Gynecol 1988. [Google Scholar]
- B M Sibai, T Gordon, E Thom, S N Caritis, M Klebanoff, D Mcnellis. Risk factors for preeclampsia in healthy nulliparous women: a prospective multicenter study. The National Institute of Child Health and Human Development Network of Maternal-Fetal Medicine Units. Am J Obstet Gynecol 1995. [Google Scholar]
- . Diagnosis and Management of Preeclampsia and Eclampsia. ACOG Practice Bulletin 2002. [Google Scholar]
- W F Keane, G Eknoyan. Proteinuria, albuminuria, risk, assessment, detection, elimination (PARADE): a position paper of the National Kidney Foundation. Am J Kidney Dis 1999. [Google Scholar]
- J Boyd, R Newall, C Price. Use of protein:creatinine ratio measurements on random urine samples for prediction of significant proteinuria: a systematic review. Clin Chem 2005. [Google Scholar]
- G Eknoyan, T Hostetter, G L Bakris. Proteinuria and other markers of chronic kidney diseas”e: a position statement of the national kidney foundation (NKF) and the national institute of diabetes and digestive and kidney diseases (NIDDK). Am J Kidney Dis 2003. [Google Scholar]
- J V Morales, R Weber, M B Wagner, E J Barros. Is morning urinary protein/creatinine ratio a reliable estimator of 24-hour proteinuria in patients with glomerulonephritis and different levels of renal function?. J Nephrol 2004. [Google Scholar]
- R K Morris, R D Riley, M Doug, J J Deeks, M D Kilby. Diagnostic accuracy of spot urinary protein and albumin to creatinine ratios for detection of significant proteinuria or adverse pregnancy outcome in patients with suspected pre-eclampsia: systematic review and meta-analysis. BMJ 2012. [Google Scholar]
- P Pallavee, S Nischintha. A comparison of urine dipstick test with spot urine protein-creatinine ratio and 24-hour urine protein excretion in women with preeclampsia. Int J Reprod Contracept Obstet Gynecol 2015. [Google Scholar]
- S Hossain, A Ghosh, A Chatterjee, G Sarkar, S S Mondal. To evaluate the diagnostic value of protein: creatinine ratio in a single voided urine sample for quantitation of proteinuria compared to those of a 24-hour urine sample in patients with preeclampsia. J Coll Med Sci-Nepal 2013. [Google Scholar]
- Introduction
- Materials and Methods
- Objectives
- Inclusion criteria
- Exclusion criteria
- Procedure of collection of material
- Statistical analysis
- Results
- Baseline Characteristics of patients
- Distribution of patients according to 24-hour urine protein
- Distribution of patients according to Spot Protein: Creatinine ratio
- Distribution of patients according to Dipstick results
- Correlation between 24-hour total urinary protein level and spot protein: creatinine ratio
- ROC Curve and Diagnostic Performance of spot protein-creatinine ratio for different proteinuria ranges in patients
- Diagnostic Performance of spot protein-creatinine ratio for different proteinuria ranges in patients
- Association of Dipstick results and spot protein-creatinine ratio in patients
- Results
- Association between Dipstick, UPCR and 24 hours protein in study group
- Distribution of patients according to Maternal Outcomes
- Distribution of patients according to Fetal outcomes
- Discussion
- Conclusion
- Conflict of interest
- Source of funding