- Visibility 123 Views
- Downloads 13 Downloads
- DOI 10.18231/j.ijogr.2025.022
-
CrossMark

Prevalence of extreme preterm, very and moderate to late preterm births and their association with risk factors – in a South Indian cohort
- Author Details:
-
 Romana Khursheed
-
Roshni Kannan
-
Farzana Begaum Dharwad *
-
Anita Dalal
-
Maryum Khan
-
Arif Maldar
Introduction
Globally, preterm birth is the leading health concern of perinatal period, given the extensive range of complications in immediate postnatal period and later life of the individual who is born too soon. It is estimated that nearly 1 million neonatal mortalities happened in year 2020 due to complications of preterm birth (PTB) (one neonate every 40 seconds) and those who survived were left with morbidities like learning disabilities, visual and hearing problems affecting adversely them and their families in addition to the burden of increased health cost.[1], [2]
Across the countries, the rate of PTB ranges from 4–16% of babies born in the year 2020. South-East Asia and sub-Saharan Africa contribute the highest i.e. over 80% of all births. India had the highest total number of preterm births in the year 2020 (3·02 million) with a preterm birth rate of 13%, and contributed to over 20% of all PTB worldwide.[3] The prevalence of preterm birth is unevenly distributed within India, ranging from 9%, 14%, 16% for rural Gujarat, Tamil Nadu, and West Bengal, respectively.[4]
Preterm data from low-income and middle-income countries (LMICs) remains scarce even though, majority to the extent of 88.56% are hospital deliveries in India in year 2019-2021.[5] Analyses of preterm data by subgroups of gestational age described by World health organisation (WHO) (<28 weeks, 28 to <32 weeks, and 32 to <37 weeks) is crucial for stratifying individual risk for programme planning, especially for the extremely preterm category (<28 weeks).[1] Reliance on study data continues to look into spectrum of PTB including its etiology, prevention and monitor the effect of interventions to reduce complications of PTB.[6]
A precise mechanism cannot be established for PTB in most cases; therefore, factors associated with PTB, have been studied to explain preterm labour. Previous research has highlighted varied etiology of preterm labour ranging from idiopathic and genetic causes to a wide spectrum of medical and obstetric diseases such as hypertension, diabetes, multiple pregnancy, uterine anomalies, cervical and endocrinological deficiencies etc.[7] Given this multifactorial etiology, WHO has suggested more research to determine the causes and mechanisms of preterm birth.[1] There have been multiple attempts to explore the multifactorial etiology for reasonable goals like early identification of high risk individuals, early pick up, prevention and effective management of PTB. Previous studies conducted in our hospital settings have highlighted that preterm birth is contributing significantly to overall Caesarean Section rates (4.4% of 44.6%) and stillbirths in a tertiary care setting in South India.[8], [9], [10] This led us to look into the prevalence and factors related to PTB in our LMIC set up. This study is an effort to determine the prevalence of total preterm births, including the prevalence under the different categories and its association with risk factors.
Materials and Methods
It is an observational cross-sectional study, conducted in Dr. Prabhakar Kore Charitable hospital, Belagavi from June 2021 to May 2022 affiliated to KAHER’s Jawaharlal Nehru Medical College. The study was approved by institutional ethic committee. (Ethical clearance number). CTRI Reg No – CRTI/2021/05/033527.
Study population
Pregnant women who are getting delivered, in less than 37 weeks of pregnancy in the labour room of the study settings, will be recruited as per inclusion and exclusion criteria.
Inclusion criteria
Pregnant women who come to labour room in spontaneous established and induced preterm less than 37 weeks.
Pregnant women who give consent for the study.
Exclusion criteria
Pregnant women with improper dating.
Sample size
Universal.
Operational definitions
Preterm birth-Preterm birth is defined as delivery which occurs in less than 37 weeks or less than 259 days of gestation, counted from the first day of the last menstrual period. It is classified as
Extremely preterm (< 28 weeks)
Very preterm (28 weeks - 32 weeks)
Moderate and late preterm (32 weeks - 36 weeks + 6 days).1 (WHO, 2022)
Data collection
All pregnant women who were in less than 37 weeks of pregnancy admitted in the labour room in established preterm labour were enrolled, as per the inclusion and exclusion criteria, after provision of a consent for the same. Gestational age was estimated from the most reliable variable by dating scan findings in first trimester record. If not available, gestational age was assigned as per the date of Last Menstrual Period (LMP), if menstrual cycles were regular. This was confirmed by obstetric ultrasound done at admission using Sonocare software used in the institute.
The antenatal history, current and past medical and obstetric history were recorded to identify any risk factor associated with PTB. After thorough clinical examination and noting investigations which were available, the risk factors were categorised into medical risk factors (acute and chronic), Obstetric risk factors (maternal and fetal) and no risk factors.
Statistical analysis
Data is analyzed using statistical software R version 4.2.1. and Microsoft excel. Categorical variables are represented by frequency and percentage. Continuous variables given in Mean ± SD / Median (Min, Max) form. Chi-square test is used to check the dependency between categorical variables. P-value less than or equal to 0.05 indicates statistical significance. For association of type of preterm labour with risk factor, the unadjusted odds ratio was calculated by Sonocare software being used in the institute.
Results
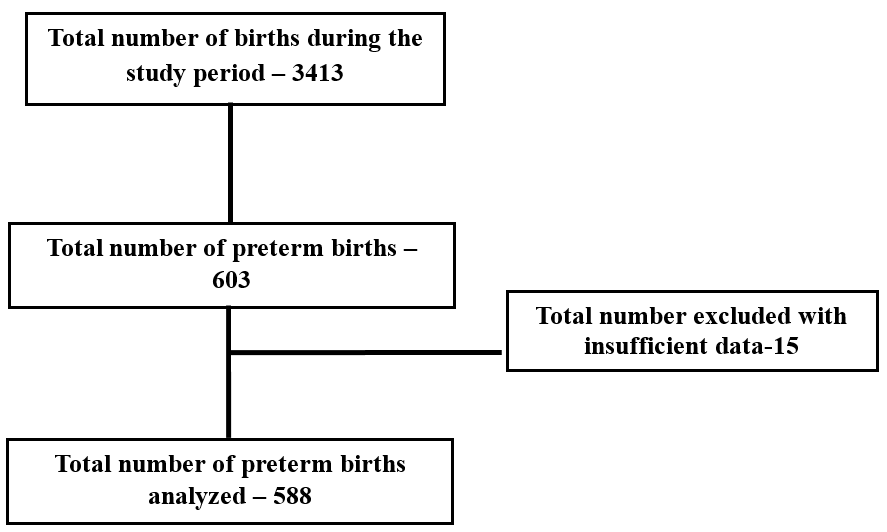
This cross-sectional study was conducted in KAHER’s Dr Prabhakar Kore Charitable hospital, Belagavi. There were 3413 births in one year study period. Among them, 603 were preterm births. A total of 15 study participants got excluded because of insufficient data. Total preterm birth analysed were 588. ([Figure 1])
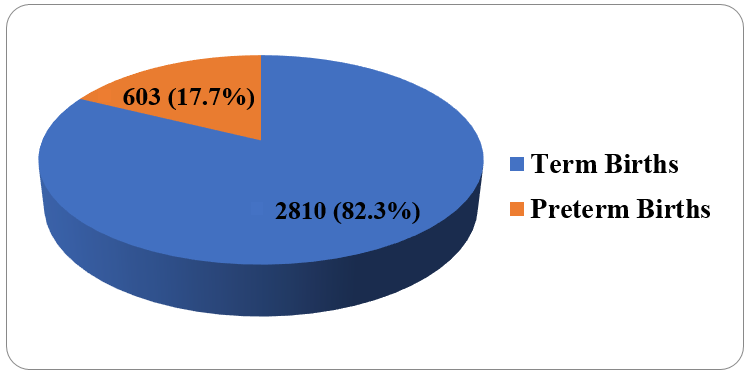
[Figure 2] depicts among 3413 live births, 603 births (17.7%) were preterm and 2810 births (82.3%) happened at term.
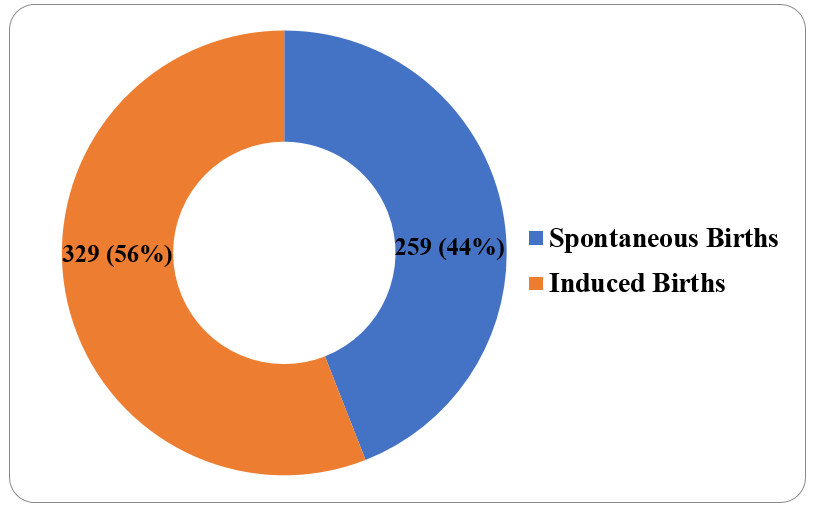
[Figure 3] shows that 329 (56%) births were provider initiated / induced births, 259 (44%) were spontaneous births.
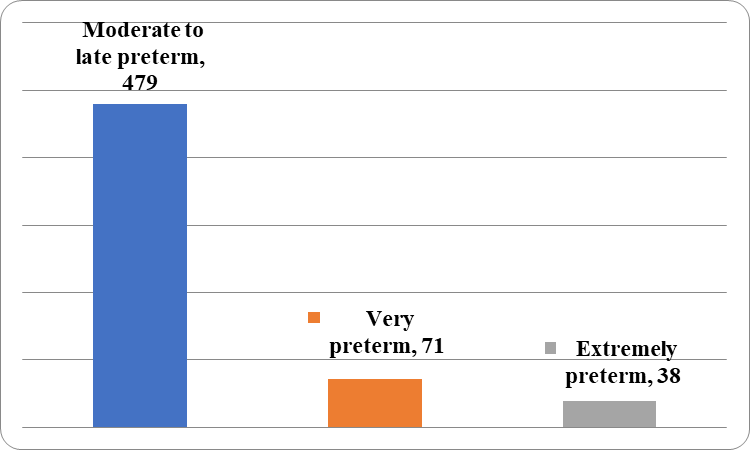
[Figure 4] depicts that among 588 births there were 479(81.46%) moderate to late preterm, 71 (12.07%) were very preterm and 38(6.46%) were extremely preterm.
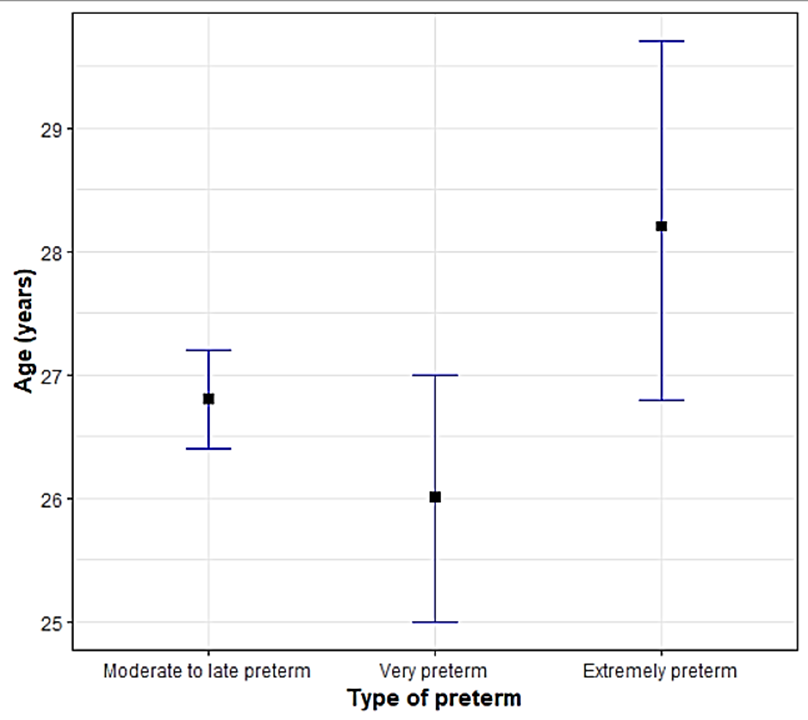
[Figure 5] illustrates that the mean age of women having moderate to late preterm birth was 26.7 years, 26 years in very preterm birth and 28.2 years in extreme preterm (p value 0.03495).
[Table 1] gives the comparison of different variables with type of PTB. Among registered gravidas, 251 (52.4%) were moderate to late preterm, 30 (42.25%) were very preterm and 25 (65.79%) were extreme births. The number of multigravidas were 274 (57.2%), 41 (57.75%), 17 (44.74%) in moderate to late preterm, very preterm and extreme preterm groups. There were 129 (26.93%), 21 (29.58%), 6 (15.79%) previous cesarean births among moderate to late preterm, very preterm and extreme preterm groups respectively.
|
Variables |
Sub Category |
Type of preterm |
p value |
||
|
Moderate to late preterm (n=479) |
Very preterm (n=71) |
Extremely preterm (n=38) |
|||
|
Registration status |
Registered |
251 (52.4%) |
30 (42.25%) |
25 (65.79%) |
0.05997C |
|
Unregistered |
228 (47.6%) |
41 (57.75%) |
13 (34.21%) |
||
|
Residence |
Rural |
195 (40.71%) |
38 (53.52%) |
14 (36.84%) |
0.0997C |
|
Urban |
284 (59.29%) |
33 (46.48%) |
24 (63.16%) |
||
|
Socioeconomic status |
1 |
190 (39.67%) |
27 (38.03%) |
13 (34.21%) |
0.7687C |
|
2 |
227 (47.39%) |
32 (45.07%) |
21 (55.26%) |
||
|
3 |
62 (12.94%) |
12 (16.9%) |
4 (10.53%) |
||
|
Addiction history |
Yes |
44 (9.19%) |
8 (11.27%) |
6 (15.79%) |
0.3299F |
|
Gravidity |
Multigravida |
274 (57.2%) |
41 (57.75%) |
17 (44.74%) |
0.3199C |
|
Primigravida |
205 (42.8%) |
30 (42.25%) |
21 (55.26%) |
||
|
Previous cesarean birth |
- |
129 (26.93%) |
21 (29.58%) |
6 (15.79%) |
0.2689C |
|
Previous history of Preterm birth |
- |
4 (0.84%) |
0 |
0 |
1F |
[Table 2] shows the distribution of acute medical risk factors in women having. There were 7 (1.46%), 3 (4.23%), 4 (2.38%) women with covid infection in moderate to late preterm, very preterm and extreme preterm groups (p value 0.0033). Acute pyelonephritis was present in 23 (4.8%) and 2 (2.82%) (p value 0.4798) moderate to late preterm and very preterm respectively.
|
Maternal acute medical risk factors |
Type of preterm births |
Total
(n=101) |
p-value |
||
|
Moderate to late preterm |
Very preterm |
Extremely preterm |
|||
|
Acute Fever |
19 (3.97%) |
7 (9.86%) |
2 (5.26%) |
28 (4.76%) |
0.0863F |
|
Acute Pyelonephritis |
23 (4.8%) |
2 (2.82%) |
0 |
25 (4.25%) |
0.4798F |
|
Diarrhea |
16 (3.34%) |
4 (5.63%) |
4 (10.53%) |
24 (4.08%) |
0.0573F |
|
COVID infection |
7 (1.46%) |
3 (4.23%) |
4 (10.53%) |
14 (2.38%) |
0.0033F* |
|
Dengue infection |
4 (0.84%) |
3 (4.23%) |
0 |
7 (1.19%) |
0.0786F |
|
Pneumothorax |
1 (0.21%) |
0 |
0 |
1 (0.17%) |
1F |
|
Bell‘s palsy |
2 (0.42%) |
0 |
0 |
2 (0.34%) |
1F |
[Table 3] depicts prevalence of chronic medical risk factors in women having PTB. Thyroid disorders were observed in 75 (15.66%), 8 (11.27%), 14 (36.84%), p value 0.0036 in moderate to late preterm and extreme preterm groups. There were 2 gravidas in extreme preterm and 1 (1.41%) in very preterm having maternal single kidney (p value 0.0017).
|
Maternal chronic medical risk factors (n=185) |
Type of preterm |
Total (n=185) |
p-value |
||
|
Moderate to late preterm |
Very preterm |
Extremely preterm |
|||
|
Thyroid Disorders |
75 (15.66%) |
8 (11.27%) |
14 (36.84%) |
97 (16.5%) |
0.0036F* |
|
Hypertension |
16 (3.34%) |
3 (4.23%) |
2 (5.26%) |
21 (3.57%) |
0.6205F |
|
Anaemia |
12 (2.51%) |
4 (5.63%) |
2 (5.26%) |
18 (3.06%) |
0.13F |
|
Diabetes Mellitus |
13 (2.71%) |
3 (4.23%) |
0 |
16 (2.72%) |
0.5197F |
|
Vaginitis |
12 (2.51%) |
1 (1.41%) |
0 |
13 (2.21%) |
1F |
|
Hepatitis |
6 (1.25%) |
0 |
0 |
6 (1.02%) |
1F |
|
Heart Disease |
4 (0.84%) |
0 |
0 |
4 (0.68%) |
1F |
|
Maternal Single Kidney |
0 |
1 (1.41%) |
2 (5.26%) |
3 (0.51%) |
0.0017F* |
|
Asthma |
1 (0.21%) |
1 (1.41%) |
0 |
2 (0.34%) |
0.3366F |
|
AIDS |
0 |
1 (1.41%) |
0 |
1 (0.17%) |
0.1854F |
|
Epilepsy |
1 (0.21%) |
0 |
0 |
1 (0.17%) |
1F |
|
Myomectomy |
1 (0.21%) |
0 |
0 |
1 (0.17%) |
1F |
|
Neurogenic Bladder |
1 (0.21%) |
0 |
0 |
1 (0.17%) |
1F |
|
Pneumothorax |
1 (0.21%) |
0 |
0 |
1 (0.17%) |
1F |
|
Psoriasis |
1 (0.21%) |
0 |
0 |
1 (0.17%) |
1F |
|
Tuberculosis |
1 (0.21%) |
0 |
0 |
1 (0.17%) |
1F |
[Table 4] demonstrates obstetric risk factors in different type of preterm births. PPROM was observed in 114 (23.8%), 25 (35.21%) and 14 (36.84%) women and extreme preterm, among moderate to late preterm, very and extreme preterm groups p value 0.0351. From Fisher’s exact test, it is observed that, there is significant difference in the distribution of PIH, GDM over type of preterm (p value 0.0001c, .0.0011F, 0.001) respectively.
|
Obstetric risk factors (n=676) |
Type of preterm |
Total (n=676) |
p-value |
||
|
Moderate to late preterm |
Very preterm |
Extremely preterm |
|||
|
PPROM |
114 (23.8%) |
25 (35.21%) |
14 (36.84%) |
153 (26.02%) |
0.0351F* |
|
Pregnancy induced hypertension |
97 (20.25%) |
27 (38.03%) |
16 (42.11%) |
140 (23.81%) |
0.0001c |
|
Antiphospholipid Antibody syndrome |
77 (16.08%) |
3 (4.23%) |
0 |
80 (13.61%) |
0.0010C |
|
Multiple Pregnancies |
63 (13.15%) |
12 (16.9%) |
3 (7.89%) |
78 (13.27%) |
0.4385F |
|
Anamnios/ oligohydramnios |
63 (13.15%) |
11 (15.49%) |
4 (10.53%) |
78 (13.27%) |
0.756C |
|
GDM |
44 (9.19%) |
0 |
0 |
44 (7.48%) |
0.0011F* |
|
RH Negative gravida |
25 (5.22%) |
2 (2.82%) |
1 (2.63%) |
28 (4.76%) |
0.6861F |
|
Ante Partum Hemorrhage |
23 (4.8%) |
3 (4.23%) |
1 (2.63%) |
27 (4.59%) |
>0.99F |
|
Cervical Incompetence |
15 (3.13%) |
1 (1.41%) |
2 (5.26%) |
18 (3.06%) |
0.4386F |
|
Polyhydramnios |
16 (3.34%) |
0 |
0 |
16 (2.72%) |
0.286F |
|
TORCH Positive status |
6 (1.25%) |
3 (4.23%) |
0 |
9 (1.53%) |
0.1878F |
|
Diagnosed Uterine Anomalies |
3 (0.63%) |
0 |
0 |
3 (0.51%) |
1F |
|
Disseminated intravascular coagulation |
2 (0.42%) |
0 |
0 |
2 (0.34%) |
1F |
[Table 5] shows distribution of fetal risk factors. FGRwas observed in 67 (13.99%), 9 (12.68%), 12 (31.58%), p value 0.0206, among moderate to late preterm, very and extreme preterm groups. Still births were 33 (6.89%), 12 (16.9%), 3 (7.89%), p value 0.0248, among moderate to late preterm, very and extreme preterm groups. All fetal macrosomia cases 26 (5.43%) belonged to moderate to late preterm group (p value 0.0406). Multiple fetal anomalies were noted in 7 (1.46%), 1 (1.41%), 5 (13.16%), (p value 0.0015).
|
Fetal risk factors
|
Type of preterm |
Total (n=296) |
p-value |
||
|
Moderate to late preterm |
Very preterm |
Extremely preterm |
|||
|
FGR |
67 (13.99%) |
9 (12.68%) |
12 (31.58%) |
88 (14.97%) |
0.0206F* |
|
Multiple Pregnancies |
63 (13.15%) |
12 (16.9%) |
3 (7.89%) |
78 (13.27%) |
0.4385F |
|
Still Birth |
33 (6.89%) |
12 (16.9%) |
3 (7.89%) |
48 (8.16%) |
0.0248F* |
|
AEDF/other Doppler changes |
33 (6.89%) |
5 (7.04%) |
5 (13.16%) |
43 (7.31%) |
0.3284F |
|
Fetal Macrosomia |
26 (5.43%) |
0 |
0 |
26 (4.42%) |
0.0406F* |
|
Multiple Fetal Anomalies |
7 (1.46%) |
1 (1.41%) |
5 (13.16%) |
13 (2.21%) |
0.0015F* |
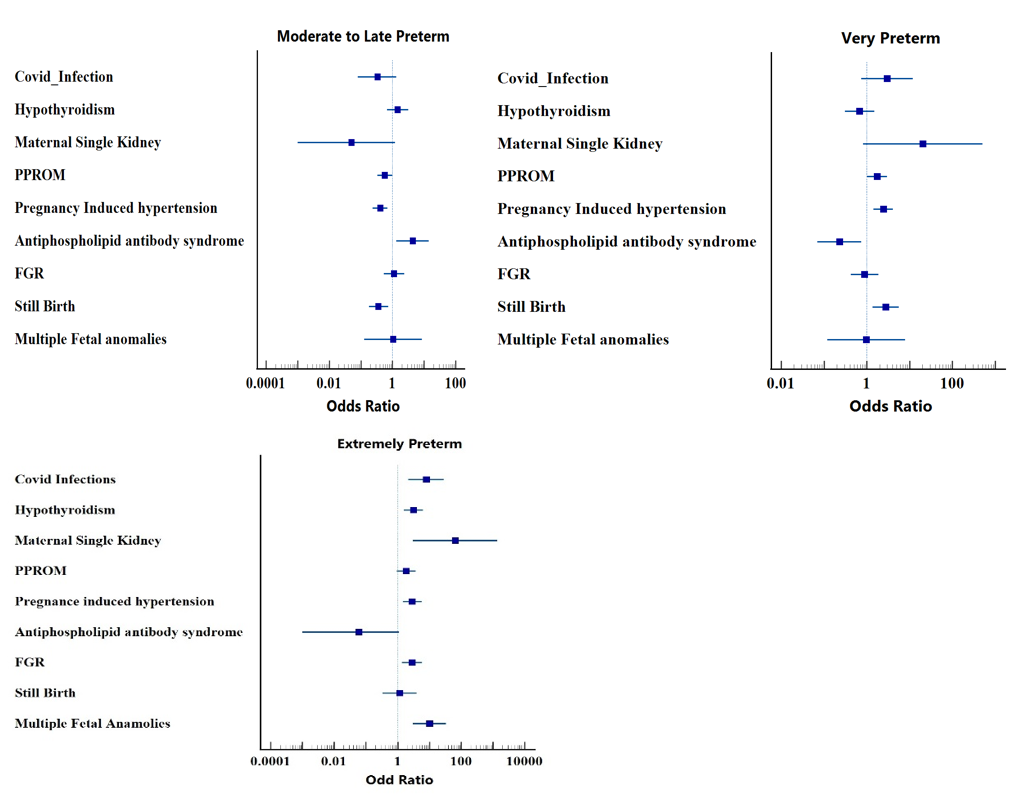
[Figure 6] illustrates the degree of association of significant risk factors with different type of PTB. We found that odds of extreme prematurity was higher for maternal single kidney, Congenital fetal anomalies, covid infection, fetal growth restriction, pre-eclampsia, still birth, hypothyroidism i.e. 65.68 [95% CI: 3.09-1393.85], 10.22[95% CI: 3.08 -33.94], 7.93 [95% CI: 2.21-28.44], 2.83 [95% CI: 1.37-5.90], 2.42[95% CI: 1.42 -4.10], 2.86 [95% CI: 1.45 -2.36], 1.16[95% CI: 0.34-3.97], 3.14[95% CI: 1.55-6.35] respectively when compared with moderate to late preterm group.
Odds of very preterm for maternal single kidney, covid infection, pre-eclampsia, stillbirth, PPROM, FGR, hypothyroidism were 20.40[95% CI: 0.82-505.77], 2.97[95% CI 0.75, 11.78], 2.42[95% CI: 1.42-4.10], 2.75[95% CI: 1.35 -5.62], 1.74 [95% CI: 1.02-2.96], 0.89 [95% CI: 0.42-1.88], 0.68[95% CI: 0.31-1.49] respectively when compared with moderate to late preterm group. Odds of moderate to late preterm for antiphospholipid antibody syndrome, hypothyroidism, FGR, congenital anomalies were 4.34 [95% CI: 1.33, 14.15], 1.46 [95% CI: 0.67, 3.18], 1.12 [95% CI: 0.53, 2.36], 1.04 [95% CI: 0.13,8.57] respectively when compared with very preterm group.
Discussion
The prevalence of PTB in our tertiary care hospital was found to be 17.67% in one year period. According to WHO data, the global preterm birth rate was 9.9% in the year 2020.[1] Previous research in PTB, from year 2010 – 2014 shows that India has an estimated 23-24% contribution to global preterm births with a national preterm prevalence rate of 13-17% (13·6%).[1], [11] Our preterm prevalence of 17.47% is higher than the national average. There can be varied reasons for the increased prevalence, like being a tertiary care hospital it receives high number of referrals from periphery for management of maternal complications and for NICU care. Stringent screening protocols lead to early detection of high-risk cases, early intervention to prevent complications while managing high risk pregnancies through institutional protocols lead to a greater number of provider-initiated preterm deliveries which contributed to 56% of total PTB in this study.
The prevalence of moderate to late preterm were 81.16% where as very preterm were 12.06% and extreme preterm were 6.46% in this study. Previous research has highlighted that the prevalence of extremely preterm is 1.72-11%, whereas moderate to late preterm births contribute maximum to overall preterm birth rates (71-85%).[12], [13], [14] Most of the medical complications of pregnancy like pre-eclampsia, diabetes, and placenta previa get well established in third trimester of pregnancy, especially after 32 weeks of pregnancy, risking life of mother, fetus or both. This increases probability of preterm termination of pregnancy, either spontaneous or provider-initiated, contributing to higher proportion of moderate to late preterm births.
A total of 329 preterm births (56%) were provider-initiated, for varied maternal and fetal causes in this study. FIGO consensus on provider-initiated PTBs has raised concern that iatrogenic deliveries have been increasing, reaching almost 50% of all preterm births.[15] It is recommended that the decision to terminate should always be individualized as safety of mother and fetus is a priority in clinical practice. The risks of morbidity and perinatal mortality related to prematurity and the possible maternal and fetal consequences of continuing a pregnancy should always be judged against the benefit of improved cognitive function to newborn specially in non-compromised mother and fetus status.[16] The obstetrician’s attitude and clinical behaviour are also important factors.
Another strategy aiming to reduce the number of late provider-initiated preterm is elective delivery at 37 or after weeks of gestation. It is recommended by multiple research studies that preterm provider-initiated delivery is not required for any of the common pregnancy conditions like chronic hypertension, FGR without fetal distress, hyperglycemia not complicated by fetal macrosomia, PPROM without sepsis, uncomplicated twins, where appropriate monitoring and elective delivery at term is advised with the exception of pre-eclampsia, in which delivery between 34 and 37 weeks can be considered.[15], [17], [18], [19]
PPROM was the most common obstetric risk factor 153 (26.02%, p value 0.0351) contributing significantly to PTBs in this study, similar to other studies.[20], [21] Odds of extreme preterm with PPROM were 1.86 [95% CI: 0.94 -3.73] for very preterm were 1.74[1.02,2.96] in our study. There is no effective intervention discovered till date for prevention of PPROM.[15] The prevalence of pregnancy induced hypertension was found to be 140 (23.81%, p value 0.0001) in this study. The odds of extreme preterm for PIH were 2.86[1.45, 5.66] and it was 2.42[1.42,4.10] for very preterm. PIH is associated with complications like abruption and eclampsia which initiate spontaneous preterm labour. Other mechanisms include inflammation, oxidative stress and chronic placental insufficiency. If there are no immediate indications for delivery, expectant management is preferable because of the neonatal risks associated with early preterm birth. Screening, prevention and effective control of hypertension are the modalities to control preterm births associated with PIH.[15], [22]
Preterm labour is one of the most frequent complications of Antiphospholipid Antibody Syndrome (APS) according to previous research.[23] In the current study, APS was identified in 80 gravidas (13.61%, p value 0.001) with higher odds with moderate to late preterm of 4.34 [95% CI: 1.33-14.15]. It is estimated in previous research that 75-80% of individuals with APS have better outcome with LMWH and aspirin.[23]
Preterm birth occurred in 44 (7.48%) women with GDM in this study. This falls within reported rates of 5.06–57.81% in various studies.[24] It is emphasised that tight glycemic control will reduce the occurrence of preterm birth. Multiple pregnancy accounted for 11.9% of the total preterm births in the study though its distribution was not significant among different categories of preterm.
In our study, history of previous caesarean section was observed more in moderate to late preterm and very preterm group 29 (26.93%) and 21 (29.58%). Zhang et al reported that caesarean section in the first pregnancy increased the risk of preterm birth (aRR 1.12, 95% CI 1.01–1.24) in subsequent pregnancies when compared with vaginal birth in first pregnancy.[25]
It was observed that extremes of the fetal growth (FGR and fetal macrosomia) were significantly associated with PTB (88 (14.97%) p value 0.0206) and 26 (4.42%) p value 0.0406) respectively in this study. The odds of extreme preterm for FGR was 2.83[95% CI: 1.37-5.90] in the study. It is reported in earlier research that both FGR and fetal macrosomia increases the risk of spontaneous and provider initiated preterm birth.[26], [27], [15] Other significant risk factors identified were stillbirth (48 (8.16%) p value0.0248) and multiple fetal anomalies (13 (2.21%) p value 0.0015). The odds of extreme preterm for stillbirth were 1.16 [95% CI: 0.3- 3.97] and for very preterm were 2.75[1.35,5.62]. It was found that the overall very preterm and extremely preterm birth risks were respectively 8.4-fold and 11.2-fold higher in newborns with congenital anomalies.[28] We found that odds of extreme preterm for fetal congenital malformations were 10.22 [95% CI: 3.08 -33.94] whereas it was 1.04 [0.13,8.57] for moderate to late preterm. Fetal malformations in general, contribute to preterm deliveries either iatrogenic or spontaneous. Screening and early detection of fetal anomalies help in early termination of pregnancy within legal limits and decrease the incidence of stillbirths and PTB.
Among the acute maternal medical conditions, distribution of covid positive mothers 14(2.38%), was found to be significant among different types of PTBs (p value 0.0033) with higher odds of 2.97[95% CI 0.75-11.78] for very preterm and 7.93[95% CI 2.21-28.44] for extreme preterm. In a large population-based study in California, covid infection was associated with preterm births significantly with very preterm births, <32week of gestation (aRR 1.1[95% CI 1.1-1.2].[29] Fever of unknown origin, acute pyelonephritis and acute gastroenteritis were observed in 28(4.76%), 25(4.25%) and 24(4.08%) women respectively. The distribution of fever of unknown origin and infections were not found to be statistically significant in the study. Fever is the manifestation of systemic inflammation associated with infections which could be a risk factor for PTB. It is estimated that over 80% of PTBs LMIC settings happened because of infections.[30] A systemic review conducted by Parris et al identified lower certainty evidence of PTB risk with urinary tract infections (OR1.8; 95%CI: 1.4–2.1), sexually transmitted infections (OR1.3; 95%CI: 1.1–1.4), bacterial vaginosis (aOR16.4; 95% CI: 4.3–62.7), and systemic viral pathogens.[31]
The chronic medical conditions like hypothyroidism and maternal single kidney had significant distribution over type of preterm (p value 0.0036 and 0.0017respectively) among the study participants. The association of hypothyroidism with preterm deliveries is studied in previous research and it was found to be significant.[32], [33] In a population based prospective study by Korrevaar et al, there was 2.5-fold increase in very preterm delivery in women with hypothroidism.[34] We found 3-fold rise in extreme preterm deliveries with maternal hypothyroidism. The odds of extreme preterm were 3.14 [95% CI:1.55-6.35] and for moderate to late preterm were 1.46 [95% CI:0.67-3.18] in the current study. Various mechanisms suggested for this association are stimulation of inflammatory process with a change in the regulation of cytokine networks in the uterus and increase in vasopressin levels in hypothyroid mothers.[34]
Maternal single kidney was found in 3 women in the study (0.51%) (p value 0.0017). The odds were 65.68 [95% CI: 3.09-1393.85] for extreme preterm and 20.40 [95% CI: 0.82 –505.77] for very preterm. Piccoli et al concluded that the risk of preterm delivery was increased in patients with a single kidney (31.1%).[35] Maternal single kidney is associated with increased risk of urinary tract infections and PIH which will enhance possibility of preterm delivery.[35]
Screening of pregnant women for obstetric comorbidities like pre-eclampsia, diabetes in pregnancy, FGR in early trimester and implementation of appropriate preventive strategies of high-risk screen positive cases as well as control of chronic medical disorders like hypothyroidism and APS in periconceptional period could impact overall preterm birth rate. Our results highlight that occurrence of risk factors in early gestation increases risk of extreme preterm birth.
Our results highlight that mean maternal age was more in extreme preterm (28.2 years vs 26 vs 26 .7 years) respectively (p-value = 0.03495). A CDC report on age specific preterm birth rates has shown mean age of women giving birth to preterm neonates as 28.3 years for overall preterm births.[36] A study from the Swedish Medical Birth Register also found that advanced maternal age is associated with an increased risk of preterm birth irrespective of parity, especially very preterm birth.[37] Primigravidas had more extreme preterm 21 (55.26%), whereas multigravidas had more proportion of moderate to late preterm incidence (57.2%). In a study conducted by Xiaohong Ji, primiparas had a 1.60-fold (95% CI 1.14–2.25) increased risk of extreme preterm birth. About 10.88% of the study population had no identifiable risk factors for occurrence of preterm birth.[37]
Strengths
This study updates trends of PTB among different gestational age-based categories plus it presents novel comparison of clinical risk factors among subgroups of preterm birth. By stratifying the risk factors in different categories, we tried to focus on specific risk factors significantly associated with different categories of preterm births. This will help researchers to formulate action plans for more targeted approach in bringing down preterm birth rates.
Limitation
Given the wide spectrum etiology of PTB, certain risk factors like sociodemographic and factors related to previous bad obstetric history could not be analysed in the study.
Conclusion
The prevalence of total PTB is 17.67% in one year period. Moderate to late preterm and provider initiated PTBs contributed maximum to the overall preterm birth rates but the extreme preterm group had strong association with different risk factors like maternal single kidney, congenital fetal anomalies, covid infection, fetal growth restriction, pre-eclampsia, stillbirth, hypothyroidism and antiphospholipid antibody syndrome among all categories. We recommend a multiprong approach so that the risk factors pertaining to medical, obstetric factors are well controlled in preconceptional and early pregnancy period reducing the risk of preterm birth. Our findings focus attention on need for programmatic and policy interventions to address the considerable burden of PTB in the country.
Source of Funding
None.
Conflict of Interest
None.
References
- . Preterm birth. 10 May 2023. [Google Scholar]
- . Born too soon: decade of action on preterm birth. 9 May 2023. [Google Scholar]
- . Ending preventable newborn deaths and stillbirths by 2030. July 2020. [Google Scholar]
- AK Kannaujiya, K Kumar, AK Upadhyay, L McDougal, A Raj, KS James. Effect of preterm birth on early neonatal, late neonatal, and postneonatal mortality in India. PLOS Global Public Health 2022. [Google Scholar]
- . National Family Health Survey -5 (NFHS-5), 2019-21 for India. 2021. [Google Scholar]
- EO Ohuma, AB Moller, E Bradley, S Chakwera, L Hussain-Alkhateeb, A Lewin. National, regional, and global estimates of preterm birth in 2020, with trends from 2010: a systematic analysis. Lancet 2023. [Google Scholar]
- RL Goldenberg, JF Culhane, JD Iams, R Romero. Epidemiology and causes of preterm birth. Lancet 2008. [Google Scholar]
- AY Reddy, A Dalal, R Khursheed. Robson Ten Group Classification System for Analysis of Cesarean Sections in an Indian Hospital. Res J Obstet Gynecol 2018. [Google Scholar]
- R Khursheed, A Dalal, A Reddy, A Gan. Analysis of primary cesarean sections in NTSV (Nulliparous, Term, Single, Vertex) in a tertiary care hospital in South India. Indian J Obstet Gynecol Res 2018. [Google Scholar]
- RV Mali, A Dalal, R Khursheed, A Gan. Association of Stillbirths with Maternal and Fetal Risk Factors in a Tertiary Care Hospital in South India. Obstet Gynecol Int 2021. [Google Scholar] [Crossref]
- AK Kannaujiya, K Kumar, AK Upadhyay, L Mcdougal, A Raj, KS James. Effect of preterm birth on early neonatal, late neonatal, and postneonatal mortality in India. PLOS Glob Public Health 2022. [Google Scholar]
- AS Morgan, M Mendonça, N Thiele, AL David. Management and outcomes of extreme preterm birth. BMJ 2022. [Google Scholar]
- ME Mowitz, W Gao, H Sipsma, P Zuckerman, H Wong, R Ayyagari. Burden of Comorbidities and Healthcare Resource Utilization Among Medicaid-Enrolled Extremely Premature Infants. J Health Econ Outcomes Res 2022. [Google Scholar]
- H Torchin, PY Ancel, PH Jarreau, F Goffinet. Epidemiology of preterm birth: Prevalence, recent trends, short- and long-term outcomes. J Gynecol Obstet Biol Reprod (Paris) 2015. [Google Scholar]
- CM Valencia, BW Mol, B Jacobsson. FIGO good practice recommendations on modifiable causes of iatrogenic preterm birth. Int J Gynaecol Obstet 2021. [Google Scholar]
- A Husby, J Wohlfahrt, M Melbye. Gestational age at birth and cognitive outcomes in adolescence: population based full sibling cohort study. BMJ 2023. [Google Scholar]
- TP Bernardes, EF Zwertbroek, K Broekhuijsen, C Koopmans, K Boers, M Owens. Delivery or expectant management for prevention of adverse maternal and neonatal outcomes in hypertensive disorders of pregnancy: an individual participant data meta-analysis. Ultrasound Obstet Gynecol 2019. [Google Scholar]
- M Boulvain, MV Senat, F Perrotin, N Winer, G Beucher, D Subtil. Induction of labour versus expectant management for large-for-date fetuses: a randomised controlled trial. Lancet 2015. [Google Scholar]
- KE Boers, SMC Vijgen, D Bijlenga, JAMvd Post, DJ Bekedam, A Kwee. Induction versus expectant monitoring for intrauterine growth restriction at term: randomised equivalence trial (DIGITAT). BMJ 2010. [Google Scholar]
- IM Sari, AC Adisasmita, S Prasetyo, D Amelia, R Purnamasari. Effect of premature rupture of membranes on preterm labor: a case-control study in Cilegon, Indonesia. Epidemiol Health 2020. [Google Scholar]
- R Gomez, F Ghezzi, R Romero, H Munoz, JE Tolosa, I Rojas. Premature labor and intra-amniotic infection. Clinical aspects and role of the cytokines in diagnosis and pathophysiology. Clin Perinatol 1995. [Google Scholar]
- H An, M Jin, Z Li, L Zhang, H Li, Y Zhang. Impact of gestational hypertension and pre-eclampsia on preterm birth in China: a large prospective cohort study. BMJ Open 2022. [Google Scholar]
- S D'Ippolito, G Barbaro, C Paciullo, C Tersigni, G Scambia, ND Simone. Antiphospholipid Syndrome in Pregnancy: New and Old Pathogenetic Mechanisms. Int J Mol Sci 2023. [Google Scholar]
- A Preda, DG Iliescu, A Comănescu, GL Zorilă, IM Vladu, MC Forțofoiu. Gestational Diabetes and Preterm Birth: What Do We Know? Our Experience and Mini-Review of the Literature. J Clin Med 2023. [Google Scholar]
- N Zhong. Achieving lower preterm birth rates in China via reductions in iatrogenic preterm births. Am J Public Health 2019. [Google Scholar]
- CR Rao, P Bhat, V Ke, V Kamath, A Kamath, D Nayak. Assessment of risk factors and predictors for spontaneous pre-term birth in a South Indian antenatal cohort. Clin Epidemiol Glob Health 2018. [Google Scholar]
- MDV Zijl, MA Oudijk, ACJ Ravelli, BWJj Mol, E Pajkrt, BM Kazemier. Large-for-gestational-age fetuses have an increased risk for spontaneous preterm birth. J Perinatol 2019. [Google Scholar]
- A Mohangoo, C Lanting, B Gravenhorst. 457 Contribution of Congenital Anomalies to Preterm Birth Risk in the Netherlands. Pediatr Res 2010. [Google Scholar]
- D Karasek, RJ Baer, MR Mclemore, AJ Bell, BE Blebu, JA Casey. The association of COVID-19 infection in pregnancy with preterm birth: A retrospective cohort study in California. Lancet Reg Health Am 2021. [Google Scholar]
- KM Parris, SM Jayasooriya, DO Anumba, SM Jayasooriya. Prenatal Risk Assessment for Preterm Birth in Low-Resource Settings: Infection. Evidence Based Global Health Manual for Preterm Birth Risk Assessment 2022. [Google Scholar]
- PM Sheehan, A Nankervis, EA Júnior, FDS Costa. Maternal Thyroid Disease and Preterm Birth: Systematic Review and Meta-Analysis. J Clin Endocrinol Metab 2015. [Google Scholar]
- MP Nasirkandy, G Badfar, M Shohani, S Rahmati, MH YektaKooshali, S Abbasalizadeh. The relation of maternal hypothyroidism and hypothyroxinemia during pregnancy on preterm birth: An updated systematic review and meta-analysis. Int J Reprod Biomed 2017. [Google Scholar]
- TIM Korevaar, S Schalekamp-Timmermans, YBD Rijke, WE Visser. Hypothyroxinemia and TPO-antibody positivity are risk factors for premature delivery: the generation R study. J Clin Endocrinol Metab 2013. [Google Scholar]
- G B Piccoli, R Attini, M Torreggiani, A Chatrenet, AM Manzione, B Masturzo. Any reduction in maternal kidney mass makes a difference during pregnancy in gestational and fetal outcome. Kidney Int 2024. [Google Scholar]
- C Ferré, W Callaghan, C Olson, A Sharma, W Barfield. Effects of Maternal Age and Age-Specific Preterm Birth Rates on Overall Preterm Birth Rates - United States, 2007 and 2014. MMWR Morb Mortal Wkly Rep 2007. [Google Scholar]
- U Waldenström, S Cnattingius, L Vixner, M Norman. Advanced maternal age increases the risk of very preterm birth, irrespective of parity: a population-based register study. BJOG 2017. [Google Scholar]
- X Ji, C Wu, M Chen, L Wu, T Li, Z Miao. Analysis of risk factors related to extremely and very preterm birth: a retrospective study. BMC Pregnancy Childbirth 2022. [Google Scholar]